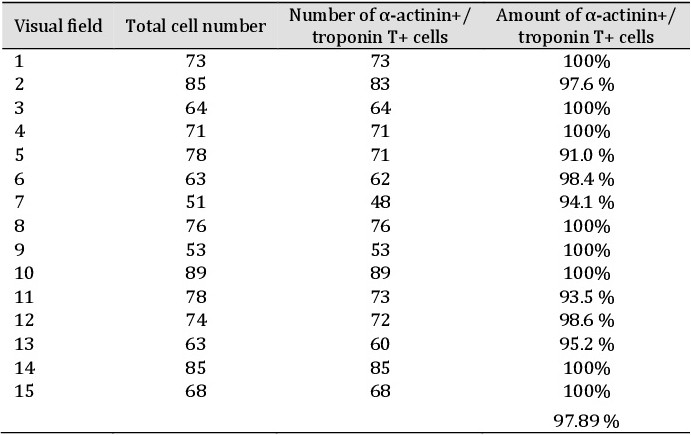
Table 1. Quantitative analysis of α-actinin+/troponin T+ cells: Microscopic analysis of fluorescent images showed that ~98% of all cells in the culture were positive for the cardiac markers α-actinin and troponin T. Cells were labelled with α-actinin and troponin T antibodies and 1071 cells were analyzed by fluorescence microscopy